
The Quad-Point Index
Let's evaluate college football wins with some fairness, not by using an arbitrary top-25 line of demarcation that can define a season. Losses should be survivable, and wins should age in real time.

If you’ve paid attention to college football at all in the last few weeks, you're well aware of the discourse surrounding the AP Poll.
It’s something I talked about briefly here last week, but the discourse has continued into this week as No. 24 Notre Dame (0-2) remained in the top-25 but USF (2-1) fell out despite winning two top-25 contests and losing to No. 4 Miami.
For the record, I think it makes sense to rank Notre Dame (their PD through two games against top-10 competition is -4), and it’s stupid to drop USF out after one loss. But that’s neither here nor there.
Instead, I want to bring back the Quad-Point Index (QPI), a system I devised last November to evaluate the overall quality of a team’s resume. People really seemed to like its rankings last season, and it picked 8 of the 12 College Football Playoff teams in November.
QPI borrows its overall architecture from college basketball’s quad system by splitting wins and losses into one of four tiers based on a game’s location and an opponent’s ranking.
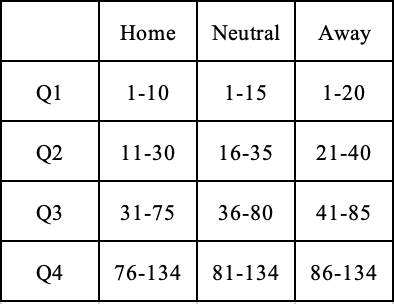
That chart can be a little confusing, so let’s use Georgia Tech and Clemson as an example.
In Week 3, Clemson was ranked No. 12 in the AP Poll, and Georgia Tech was the home team. So, Georgia Tech’s win over Clemson would count as a Quad 2 win. If Georgia Tech had been on the road, it would have been a Quad-1 win.
It is worth noting that QPI doesn’t actually use AP Poll rankings. Last season, I used CBS’s 134 rankings, the Athletics’ 134 rankings, and Warren Nolan’s Elo Ratings.
I’m using CBS and Nolan’s Ratings again this year, but the Athletic changed how they display their data, so in the interest of saving time while web scraping, I switched to Bill Connelly’s SP+ Rankings.1
I also want to point out that these results aren’t locked in at the time they happened. I don’t like the idea of pretending the rest of the season after the game didn’t happen. It did, and that should be acknowledged.
This can be good for teams like Florida, who, in theory, would have seen South Florida’s rating increase, and thus their penalty for losing decrease.
The inverse is true for Georgia Tech; Tech should want Clemson to win out, so the reward for the win is maintained or even increased.
And the “twist” for QPI is that I actually assign points for wins and then take them away for losses.
A Q1 win nets you 8 points, while a Q1 loss is -1. Each tier down cuts the reward in half while it doubles the penalty, so Q2 wins are 4 points while Q2 losses are -2, and so on.
My idea for that scale came from Notre Dame’s loss to NIU; that loss was devastating at the time, and hurt the Irish’s CFP chances. But they did overcome it by stacking good wins, and QPI’s scale reflects that possibility.
So, who does QPI have as the top-12 teams now?
All things considered, I’m pretty happy with 1-8; after that, the list is a bit hit or miss.
I recognize that Iowa State has an advantage by having played four games compared to most other teams, which have only played three. PPG or Points Per Game serves as a tiebreaker.
And as a clarifier, QPI Rank is the ranking that the system is using internally to make its quad evaluations.
Performance is the team’s current number of points divided by their total number of points possible. For now, most teams pretty much have a 100% performance, somewhere close to 0, or run into the negatives. That’ll become a more important metric later in the season.
One thing I want to emphasize is that QPI is not intended to be predictive. Its own internal rankings, or points assigned, are not good at forecasting wins. QPI is very much a reactive metric.
With the limited sample size of games, both teams and points will bounce around quite a bit. I expect the rankings to begin stabilizing in the next 2-3 weeks, with a clearer bracket taking shape.
But I do view that volatility as a strength of QPI, not a flaw.
Its own underlying rankings will fluctuate each week, and that will have ramifications for all 136 teams. Quite frankly, I want QPI to bounce around a lot early on. If I wanted a system that ignored results on the field and instead had a brand bias, I’d stick with the AP Poll.2
QPI only has as much bias as its providers do, and I think SP+ and Nolan’s rankings are incredibly fair. And CBS isn’t afraid to hammer an underperforming team.
I plan to publish a dedicated landing page for QPI, much like how the CFB and NFL Elo Models have their own pages in the TDRD section. I’ll also reference it in any bracketology piece I do in the coming weeks, and of course, if I ever need to knock the AP Poll.
But until all that, thanks for reading.
In the past, I used an average of the three polls; however, now each team receives points based on its rankings in all three polls. The team with the most points is ranked No. 1.
If this reads like a shot, that’s because it is. I’ve been increasingly unhappy with how little AP Voters seem to pay attention to the sport. It’s hard when you’re a beat writer, but not impossible. Mistakes happen, but let’s not be sloppy.