


The 12-Team CFP Might be Broken. Here's a Way to Fix it.
The CFP's job was hard enough picking four teams. Now the committee has to pick 12, most of whom belong to super leagues. Nobody is happy with the rankings. So how should we go forward?

Last season was bittersweet.
It was the end of the four-team CFP, the last season of the PAC-12, and the last year of Texas and Oklahoma in the Big 12. It was the end of an era, an era which I had thoroughly enjoyed.
But this year promised potential. The 12-team CFP would prevent snubs like FSU (‘23), TCU (‘14), and UCF (‘17). Super conferences promised year after year of marquee games between bluebloods and heavyweights.
But for all the promise of expansion, adding a Group of 5 spot feels more like a forced consolation prize for smaller programs, something that I’m sure the CFP would like to eliminate.
And there have been heavy-weight games, but increased conference size means that top-tier programs aren’t guaranteed to play each other. There are realistic situations where the SEC will need tiebreakers to pick its conference championship participants.
That could be a bit of a one-off. Georgia and Alabama don’t feel nearly as dominant as in years past. Ole Miss pushed its chips to the center of the table. Tennessee and Texas A&M have both had strong years.
It seems unlikely that the SEC will be as likely to need tiebreakers this late into the season going forward. But it’s a lot more likely now than it was before.
And that isn’t good news for college football.
Four top-five teams in the AP Poll and CFP Rankings are in the Big Ten, partly because they won’t play each other or other heavyweights this season.
Here’s how the schedule worked out:
Oregon: played Ohio State
Ohio State: played Oregon, played Penn State, plays Indiana
Penn State: played Ohio State
Indiana (yes, Indiana): plays Ohio State
These four teams could realistically finish the season with a combined three losses, which creates a log jam at the top of the CFP rankings. Two of the four teams feel like they don’t deserve to be that high.
But what does deserving even really mean? If it means who could realistically win every year, then why even play a single snap? Ask an expert and write some code. I’ll see you in December.
But if it means who earned a shot well, we have a different problem. What’s a good win? What quantity of “good” wins cancels out a “terrible” loss? How do you factor in “good” losses? Does 12 mediocre wins mean a team automatically qualifies?
Defining what deserving meant was problematic when the CFP only took four teams. With 12 teams, it feels like an issue that looms over the whole sport.
Perhaps I’m overreacting. We’re late in the season, yes, but some of these issues can still be worked out.
And if nothing else, the expansion to 12 teams was timed incredibly well because with these “super-conferences,” how would the CFP Committee even pick four teams this season? I doubt it would be Oregon, Ohio State, Texas, and Penn State.
But that’s part of the problem. The format fundamentally changes how we rank these teams. It should be the same, regardless of the format.
So, I have a proposal. It’s more of a starting point than a proper solution. However, we need to change how we grade teams. And it starts with borrowing the quad system from college basketball.
The Quad System
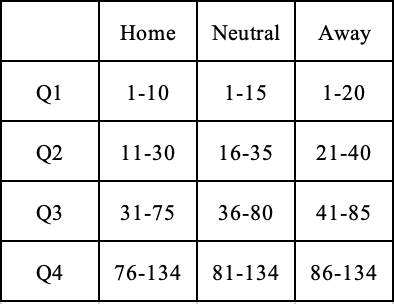
For those who don’t know, the quad system, or quadrant system, tries to group college basketball wins and losses by quality, taking into account the opponent rankings and the location of the game.
It works like this:
Quadrant 1: Home 1-30, Neutral 1-50, Away 1-75
Quadrant 2: Home 31-75, Neutral 51-100, Away 76-135
Quadrant 3: Home 76-100, Neutral 101-200, Away 135-240
Quadrant 4: Home 161-353, Neutral 201-353, Away 241-353
One of the quadrant system’s greatest strengths is that it recognizes that a win at home is much easier to come by, while a win on the road is much harder.
It also portions teams differently than just evenly splitting them into quarters. A quadrant one win is hard to come by, in part because the bucket of teams that qualify as a quadrant one team is that much smaller than quadrant two.
Another strength of the quad system is that a win doesn’t lock into place immediately after the result. If an underdog knocks off a blueblood, the win turns into a Q1 win, but it could slide if that blueblood has a down year.
I wrote about the quad system in July and tried using it to predict how the CFP race would wind up. It’s worth revisiting if you want a deeper explanation of how I devised the college football quad system, but for now:
It roughly maintains the same proportions of teams in each quadrant
The quadrants change depending on home, neutral, and away
Wins are not locked in based on the rank at the time of playing
So, with the quads set in place, I went back and created quad records for the top 15 teams in college football. Here’s what I came up with:

As interesting an exercise as it was, it didn’t feel all that helpful. College basketball's advantage is the quantity of games, so their quad records offer greater insight.
So, I decided to devise a scoring system based on the result and quadrant of each game.
Q1 Win: 8
Q2 Win: 4
Q3 Win: 2
Q4 Win: 1
Q1 Loss: -2
Q2 Loss: -4
Q3 Loss: -8
Q4 Loss -16
Initially, my thought process was to punish teams for bad losses rather than reward them for good ones. Take Notre Dame for example. The Irish beat Texas A&M, a Q1 win, but lost to NIU, a Q4 loss, and were dropped dramatically in the AP Poll.
That version looked like this:

I played with the scale by modifying how many points a given team lost for a Q4 loss, at first reducing the penalty by a quarter.

I eventually settled on making the scale even: a Q1 win got you +8, and a Q1 loss cost you -8. This ensured that a Q4 loss canceled out any goodwill a team received but didn’t punish a team so much that they couldn’t overcome it.

When I posted the first few versions on Twitter, one of the common complaints that I got was how I determined opponent rankings: ESPN’s FPI.
While I like ESPN’s FPI, it wasn’t the best choice to act as a filter for the quad system. FPI is meant to be predictive rather than accurately reflecting past results.
A great example is USC. FPI ranks USC 18th, but the Trojans are likelier to finish below .500 than bowl-eligible. That means a bad team was a signature win for a handful of programs.
Penn State was 1-1 in Q1 games, with the win against USC. LSU’s loss to USC was considered a quad-two loss, which helped minimize the points the Tigers should have lost.
So, I decided to average three rankings to get the base rankings for the quadrant system: CBS 134, the Athletic’s 134 Rankings, and Warren Nolan’s Elo Rankings.
The change was dramatic.

Here’s a brief explanation of some of the columns because I recognize it’s a monstrous table.
The win column sums all the points assigned from a win
The loss column sums all the points assigned from a loss
The net column is the difference between win points and loss points
Points per game is the net column divided by the total number of games
Percentile is how many points you have relative to the top team
Performance is how many points you have earned divided by how many points you could have earned
Points per game primarily serve as a tiebreaker. If two teams are tied, the team with the higher points per game gets the nod because it means they have more games to go and should earn more points in the future.
Performance is my favorite metric because it tells you how well a team has taken advantage of its schedule. Take Army, for example which has dominated its schedule, which consists of a single Q3 team and eight Q4 teams.
That means Army will likely never be one of the teams projected to go to the CFP, but to date, that’s not through their own fault. It’s the schedule. Performance recognizes that.
Conversely, a team like Georgia with a high point total has a low Performance metric because it has left a full 16 points up for grabs. Georgia hasn’t taken advantage of its schedule.
Now What?
What I was hoping to develop when I started this project was a system that would reward being undefeated but would be able to discern the difference in the strength of schedule without needing to input it manually.
The first version rewarded undefeated teams but couldn’t distinguish between BYU and Oregon. Being undefeated this late in the season is impressive, but BYU and Oregon are perceived differently.
The final version could tell the difference between Army and Indiana, but more importantly, the difference between Indiana and BYU/Oregon.
Now, the model rewards teams who have won Quad 1 games; eight of the top 12 teams have Q1 wins. Of the four that don’t, two haven’t played a Q1 foe.
The model also can knock out teams that haven’t won a Q1 game; of the remaining 13 teams, eight have a below-.500 Q1 record. Louisville is exactly .500. The other four haven’t played a Q1 game yet.
So, what does the bracket look like?

I don’t think this is what the bracket will look like in a month or even on Sunday.
Georgia versus Tennessee is a potential elimination game that will shake up these rankings dramatically. Miami and SMU could play in the ACC title game. Kansas State can only make the CFP as the Big 12 Champion.
But I do like most of the teams in the field, and the order isn’t too outrageous. Again, I do think it will change.
This system isn’t perfect. It doesn’t factor in margin of victory, so a Q1 win clinched by a field goal is the same as a Q1 win by 30. It also relies on accurate external rankings.
I don’t see this model as a predictor. It’s too unbiased, unlike the CFP Committee and AP Polls. The only brand bias in the system is from the polls, which hopefully can be negated by averaging rankings.
That’s why I’m dubbing this model the “Quad-Point Index.” It’s not a predictor; it’s a quick way to aggregate records and add missing context that the top 25 wins can’t offer.
I think the QPI can serve as a good check for ranking teams. Teams like Texas (13 points, .684 Performance) and Penn State (13 points, .591 Performance) shouldn’t be ranked inside the top-5.
People might disagree with the current rankings, and that’s fine. They’ll change, and the picture will get clearer. That’s why we play games.
Because that’s my favorite part of QPI. I didn’t have to mention the word “earned” once. And that’s a start.